Living Planet Index


Indicator Development
The method to calculate the LPI has been revised twice since the index was developed in 1997, firstly to advance the modelling framework and secondly to introduce the weighted approach to index aggregation, which is currently used. In parallel, other methods for modelling the data and applications of the indicator continue to be explored.
For transparency and to confirm the robustness of the LPI trends, sensitivity tests are regularly performed on the global dataset and shown in the technical supplement to the Living Planet Report and on this website, in line with new content added following recommendations from the participants of the LPI workshop held at ZSL in September 2023.
Sensitivity tests have also been carried out on the dataset used to calculate the Canadian LPI and the Canadian Species Index. Currie et al. (2026) explored multiple methodological options related to the treatment of zero values, the calculation of confidence intervals and the representation of uncertainty, the data inclusion requirements (time series length and number of data points), the modelling of short time series, the removal of outliers, the type of weighting used, and the choice of baseline. Work is under way to test different modelling frameworks and weighting options on the global LPI as well.
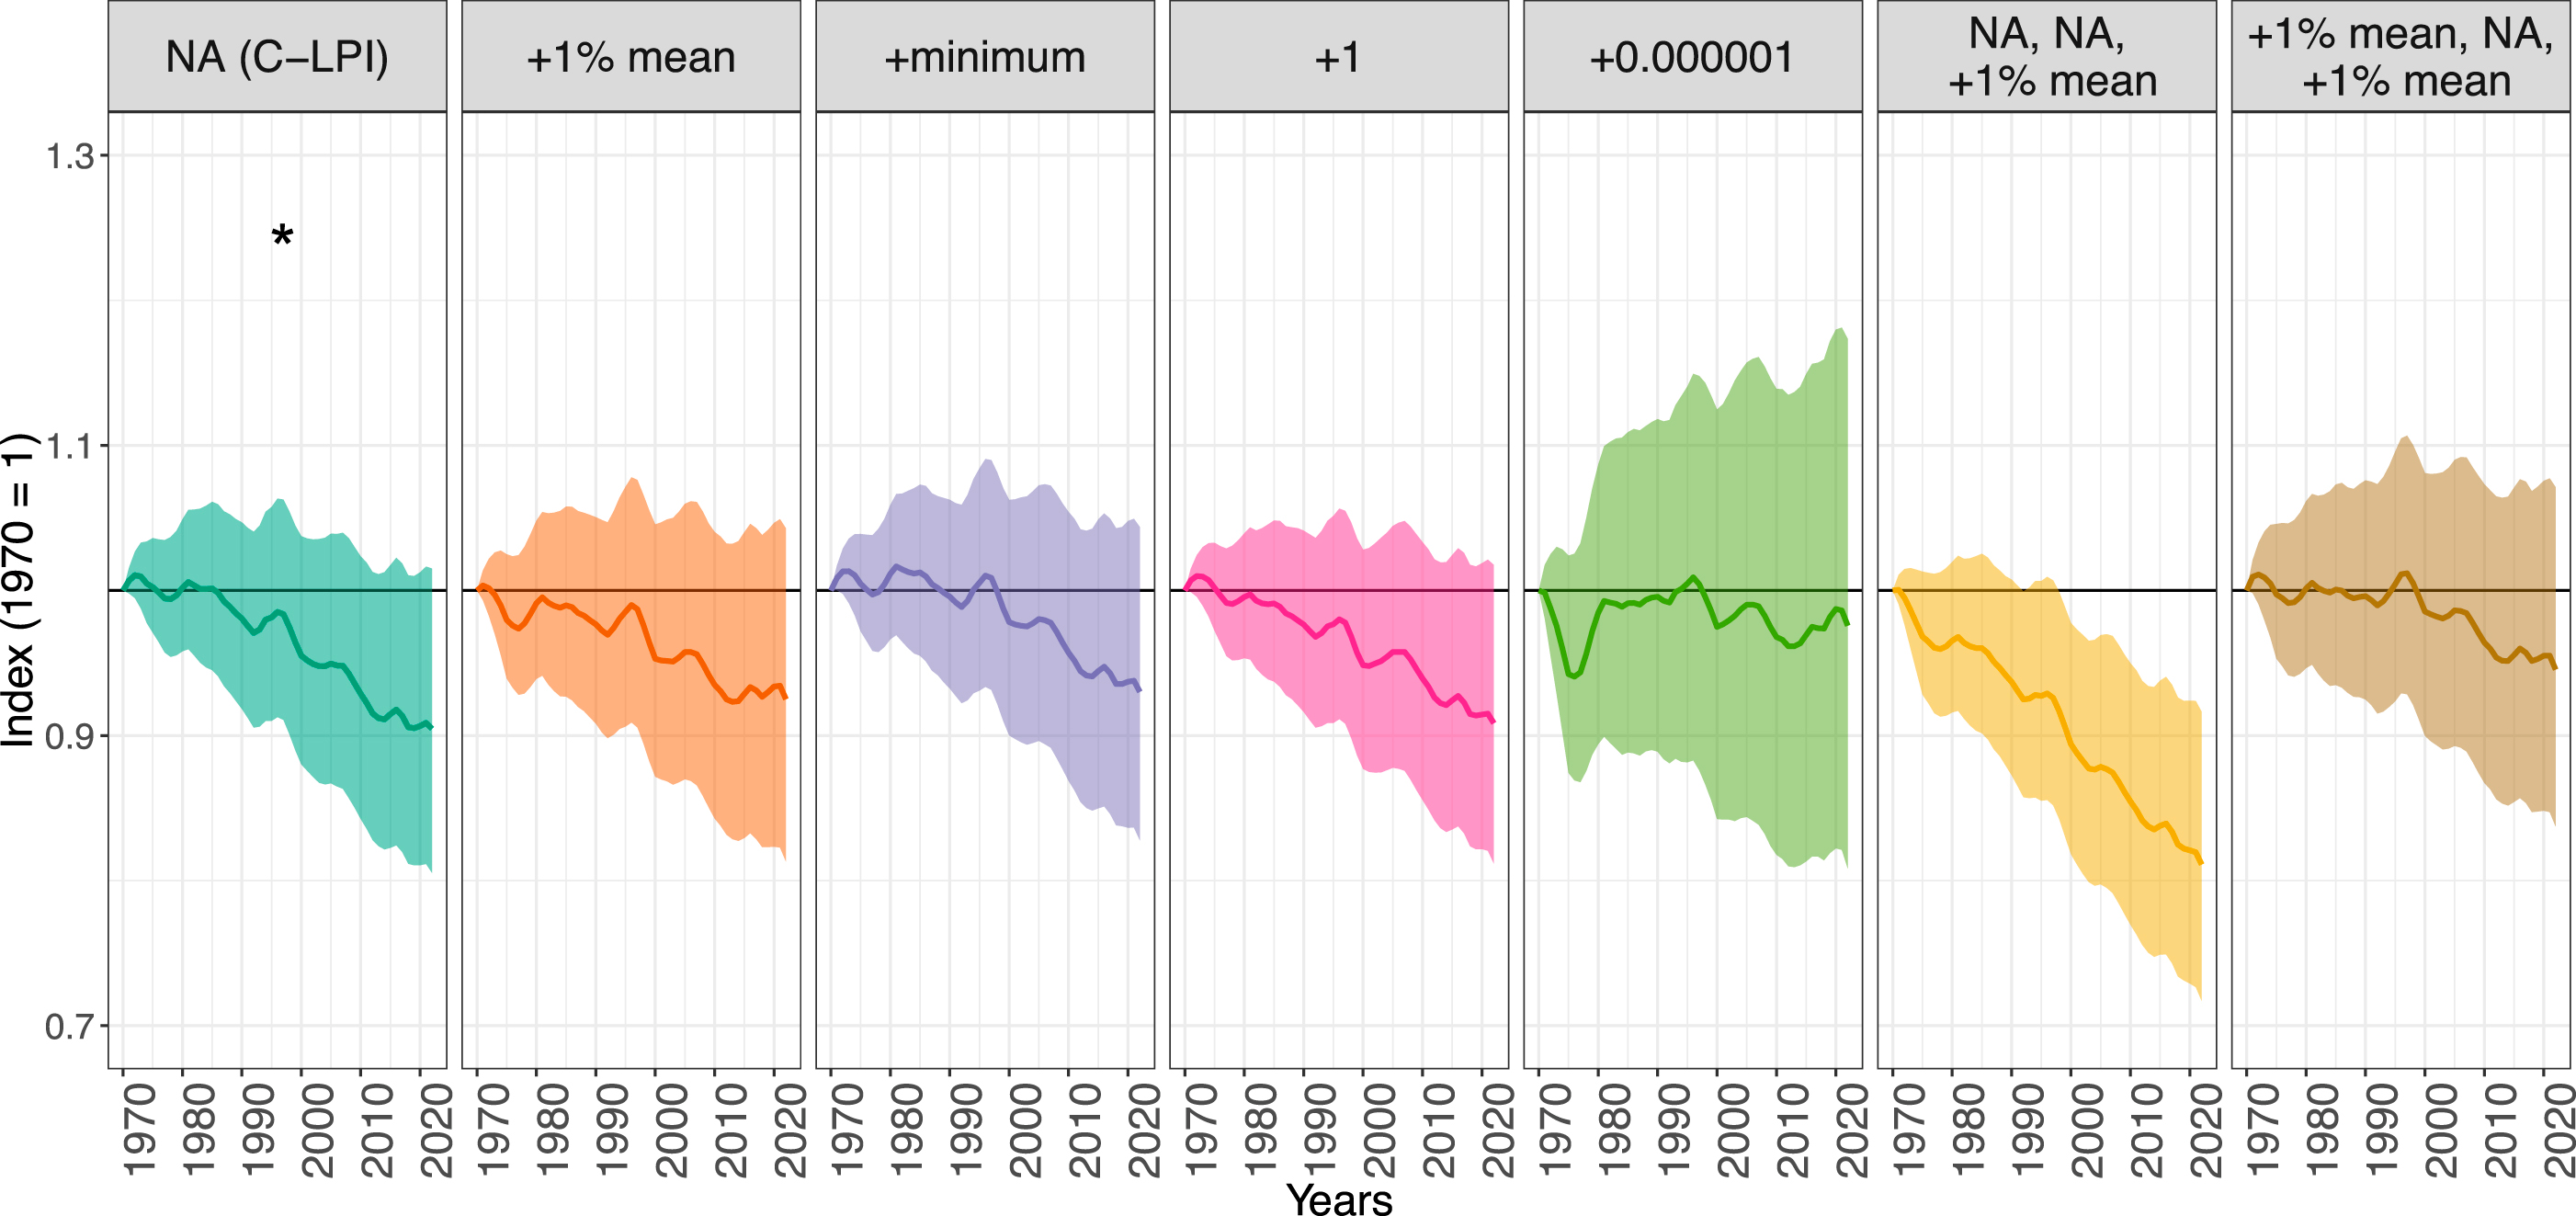
Figure 1. Sensitivity analysis results for the Canadian Living Planet Index (LPI), from Currie et al. (2026).
The data in the LPD also enables the creation of statistical models of how species abundance responds to anthropogenic land-use and climate-change (Spooner et al. 2018; Cornford et al. 2023).These models can be used to make spatial, temporal, and potentially taxonomic extrapolations of population trends to anthropogenic pressures.New developments in machine learning present an opportunity to advance these models to produce robust and accurate predictive models of biodiversity change, which can in turn provide policy makers with the tools they need to report and embed biodiversity trends in national and international policy. The LPI team is working with colleagues at ZSL and collaborators based at the International Institute for Applied Systems Analysis (IIASA) to produce robust predictions both at the global and at the national scale. Work is also underway to establish a forecasting horizon for LPI time-series, by testing the accuracy of a suite of modelling tools in predicting interannual change.
The LPI team is also developing a protocol for adding spatial extent data to LPI time-series, which are currently represented by point data (the coordinates of the mid-point of the monitoring area). Storing spatial polygons representing the precise survey area alongside the data would allow for a much wider set of analysis and for finer-scale extraction of the relevant information on drivers, which could result in better predictions.